
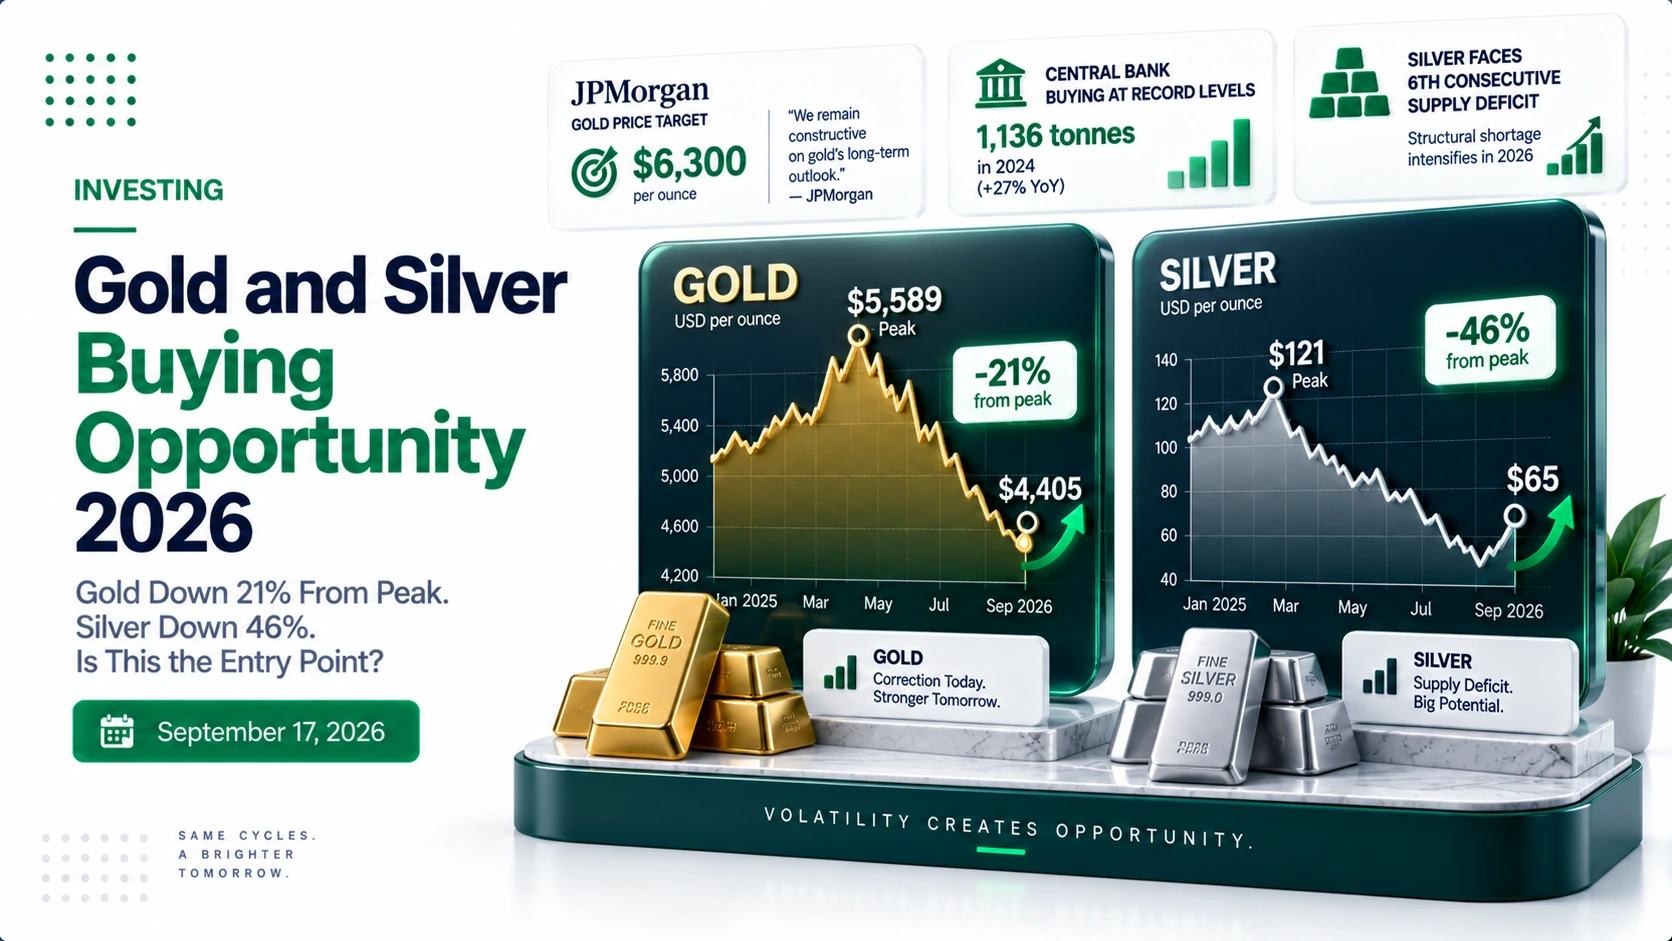
- Gold peaked at $5,589 in January 2026 and is now at $4,405 — a 21% pullback from its all-time high, driven by the Fed’s first rate hike since 2023
- Silver peaked at $121.60 in January 2026 and is now at $65.88 — a 46% pullback, making silver the deeper discount of the two metals right now
- JPMorgan targets $6,300 gold by year end 2026 — a 43% gain from today’s price. Goldman Sachs projects $5,400. Bank of America sees $4,360.
- Silver is in its sixth consecutive annual supply deficit in 2026 — 46.3 million ounces short — a structural shortage that the Fed cannot fix
- Central banks bought a record 289 tonnes of gold in Q2 2026 alone — treating every price dip as a buying opportunity, not a warning sign
The gold and silver buying opportunity of 2026 just got more interesting — and more complicated — in the same 24 hours.
Yesterday the Federal Reserve raised rates for the first time since 2023. Gold initially crashed, then recovered. Today gold is at $4,405, up from yesterday’s low of $4,294. Silver is at $65.88, up 1.49%. One analyst’s headline this morning: “Gold’s Post-FOMC Round Trip: From Crash to Comeback in 18 Hours.”
That 18-hour round trip tells you almost everything you need to know about what is happening in precious metals right now. The Fed hike created panic. The panic created a buying opportunity. The buying opportunity was taken — within hours — by investors who had been waiting for exactly this kind of pullback.
But is the pullback over? Are metals heading higher from here? Or is more pain ahead as the Fed signals additional hikes?
Here is the complete honest picture — with the real price data, the institutional forecasts, the structural case, and the exact framework for deciding whether gold or silver belongs in your portfolio right now.
- What just happened — the full 2026 price story
- Why the Fed hike hit metals so hard
- What the banks are forecasting — and why they disagree
- The silver case — why the pullback is deeper and the deficit is real
- The structural case that the Fed cannot change
- Should you buy gold or silver right now?
- Frequently Asked Questions
What Just Happened — The Full 2026 Price Story
To understand whether this pullback is a buying opportunity, you need to see the full price journey — not just today’s number.
| Date | Gold Price | Silver Price | What Drove It |
|---|---|---|---|
| January 2026 peak | $5,589 | $121.60 | All-time highs — Iran war, dollar debasement fears |
| February–April 2026 | Fell sharply | Fell sharply | Rising rate hike expectations, dollar strengthened |
| August 2026 | $4,577 | $68.20 | Partial recovery — debasement trade revival |
| September 1, 2026 | $4,339 | $64.13 | Sharpest one-day drop since Jackson Hole — rate hike bets hit 70% |
| September 16, 2026 | $4,294 intraday low | $63.49 intraday low | Fed hikes rates — metals crash on announcement |
| September 17, 2026 — today | $4,405 — recovering | $65.88 — up 1.49% | Post-FOMC round trip — buyers stepped in after the crash |
The number that puts everything in context: gold’s 52-week range runs from $3,660 to $5,627. Today’s price of $4,405 sits in the lower half of that range — 21% below the peak, 20% above the yearly low. Silver’s 52-week range runs from $41.49 to $121.79. Today’s $65.88 sits near the lower third of that range — 46% below its January peak.
Both metals have pulled back significantly from euphoric highs. Both recovered sharply within 18 hours of the Fed decision that was supposed to crush them. That recovery is the most important data point of the week.
External resource: Gold price outlook September 2026 — GoldSilver.com
Why the Fed Hike Hit Metals So Hard
Understanding why gold and silver fell helps you understand whether the pullback is a temporary dip or the beginning of a longer decline.
The mechanism is straightforward: a Fed rate hike raises real yields — the return on cash and bonds after inflation. Gold and silver pay no yield. When real yields rise, investors sacrifice more potential income by holding metals instead of bonds. That makes metals relatively less attractive, and prices fall.
The formula that drove September’s volatility: Fed-rate-hike odds for the September 16 decision swung from 54% to 26% to 58% in six weeks. Gold tracked every move. When hike odds fell, gold rallied. When Warsh’s tone turned hawkish, gold gave it back. The metal was essentially pricing Federal Reserve probability rather than its underlying fundamentals for most of August and September.
What the 18-hour recovery tells you: the moment the hike was actually announced — the uncertainty resolved — buyers stepped back in. The hike had been priced into the market over weeks of anticipation. Once it happened, the overhang cleared. Gold’s post-FOMC round trip from $4,294 back toward $4,405 within 18 hours is a textbook example of “buy the news after selling the rumor.”
What comes next depends on one number: the 10-year real yield. Only the odds moved, and they moved fast, repeatedly. The Fed funds target has sat at 3.50% to 3.75% through five consecutive 2026 meetings. If real yields push past 2.6% and stay there, metals face continued pressure. If they stabilize or fall — which happens when inflation data surprises to the downside — metals have room to recover toward institutional targets.
What the Banks Are Forecasting — And Why They Disagree
The institutional forecasts for gold by year end 2026 show one of the widest spreads between major banks in recent memory — which itself tells you something important about uncertainty.
| Institution | Gold Year-End Target | Implied Gain From Today | Key Assumption |
|---|---|---|---|
| JPMorgan | $6,300 | +43% | Central bank buying accelerates, dollar weakens |
| Goldman Sachs | $5,400 | +23% | Fed pauses after September hike, real yields stabilize |
| HSBC | $4,560 average | +3% | Rates stay elevated, gold range-bound |
| Bank of America | $4,360 | -1% | Second rate hike possible, real yields stay high |
The gap between JPMorgan’s $6,300 and Bank of America’s $4,360 is $1,940 per ounce — an unusually wide divergence between major institutions working from the same underlying data. That’s an unusually wide gap between two banks working from the same underlying data.
What explains the gap: the bull case (JPMorgan) rests on central bank buying continuing to accelerate and the dollar eventually weakening as the US debt trajectory becomes unsustainable. The bear case (Bank of America) rests on real yields staying elevated long enough to keep the opportunity cost of holding gold uncomfortably high. Both scenarios are plausible. Neither is certain. That uncertainty is exactly what makes the current price interesting for long-term investors.
Read more on gold: Gold Is at $4,400 in 2026 — Is It Too Late to Invest?
The Silver Case — Why the Pullback Is Deeper and the Deficit Is Real
Silver’s 46% pullback from its January peak is significantly deeper than gold’s 21% decline — and the reason behind that divergence creates a specific case worth understanding.
Silver has a dual role that gold does not: it is both a monetary metal and an industrial material. When rate hike fears dominate — as they did throughout September — silver gets hit on both sides simultaneously. Rising real yields reduce demand for the monetary side. Fear of economic slowdown reduces demand for the industrial side. That double pressure explains why silver fell harder than gold during the September selloff.
But the supply picture underneath the price action is telling a completely different story:
- The Silver Institute’s World Silver Survey 2026 confirms silver’s fifth consecutive annual deficit ran through 2025 at 40.3 million ounces. It forecasts a sixth consecutive deficit in 2026, at 46.3 million ounces — a wider shortfall than the year before.
- Cumulative drawdown of above-ground stocks since 2021 now totals 762.1 million ounces.
- AI data centers now need silver for power systems — a new demand source that is growing alongside the AI infrastructure buildout
- Solar panel manufacturing continues expanding — each panel requires silver, and solar installations are accelerating globally
The key insight: the Fed’s rate decision does not add a single ounce to silver’s above-ground supply. It does not reduce the solar panel installations that need silver. It does not slow the AI data center buildout. The supply deficit is a structural fact that monetary policy cannot touch. The price is reacting to short-term rate fears. The fundamentals are pointing in the opposite direction.
The gold-to-silver ratio today: approximately 67 — meaning one ounce of gold buys 67 ounces of silver. The long-term historical average is 50–65. When the ratio is above 70, silver is historically cheap relative to gold. At 67, silver is approaching that historically cheap threshold — which is why some analysts are specifically highlighting silver over gold at current prices.
Read the full silver analysis: Silver Is at $68 and Nobody Is Talking About It — Should You Invest?
The Structural Case That the Fed Cannot Change
The most important argument for gold and silver in 2026 has nothing to do with the Fed’s September decision — and everything to do with forces that no rate hike can reverse.
US national debt above $40 trillion
The US national debt has crossed $40 trillion. Net interest spending is on pace to exceed $1 trillion in fiscal 2026 — more than the entire defense budget. At some point, the math of servicing this debt requires either inflation, currency debasement, or both. Gold and silver have historically been the primary beneficiaries of currency debasement — which is why central banks worldwide are buying them at record rates even as they simultaneously raise rates to fight inflation.
Central banks bought a record 289 tonnes in Q2 2026 alone
Central banks remain the structural bid beneath this tape: the World Gold Council pegged official-sector net buying at a record 289 tonnes in the second quarter, a fivefold jump from Q2 2025. These are sovereign governments treating gold price weakness as a buying opportunity — not a warning sign. When the largest and most sophisticated institutional buyers in the world consistently add to positions during pullbacks, the directional signal is worth noting.
The 10-year real yield constraint
Real yields are the primary near-term headwind for gold and silver. But real yields above 2.5% have historically been difficult to sustain for extended periods without triggering economic slowdowns that force the Fed to reverse course. The 10-year yield hitting 5% today — its highest since 2007 — is the same level that preceded the 2008 financial crisis. Whether that level proves sustainable in 2026’s economic environment is the single most important variable in the metals outlook for the rest of the year.
Should You Buy Gold or Silver Right Now?
The honest answer — the one most articles in this space avoid — is that this depends entirely on why you are considering buying and what role precious metals would play in your portfolio.
If you do not own any gold or silver — should you start now?
Gold at $4,405 and silver at $65.88 are both significantly below their 2026 peaks. If you believe the structural case — debt debasement, central bank buying, supply deficits — the current prices represent a 20 to 46% discount from where these metals were nine months ago. The question is not whether the price is lower than it was. The question is whether the reason for owning precious metals applies to your situation.
Precious metals serve one primary portfolio function: they tend to hold value when paper currencies lose purchasing power. If your financial situation has meaningful exposure to inflation risk — a fixed salary in an inflationary environment, savings in cash that is losing real value — a small precious metals allocation (3 to 5% of your portfolio) is a reasonable hedge. If your portfolio is already well-diversified across stocks and real assets, precious metals are an optional addition, not a necessity.
If you already own gold or silver — what should you do?
The pullback from January peaks is significant but not catastrophic. Gold is still up dramatically from any 3 to 5 year holding period. Silver, despite the deeper pullback, remains in the upper half of its 5-year price range. The worst decision most precious metals holders make during pullbacks is panic-selling at the exact moment that institutional buyers — like the central banks buying 289 tonnes in a single quarter — are adding to positions.
If your precious metals allocation has drifted below your target weight due to the price decline, mechanical rebalancing — adding back to your target percentage — is the disciplined approach. If you bought near the January peak at $5,589 and are sitting on losses, the fundamental question is whether the reason you bought has changed. If it was a long-term inflation hedge, a Fed rate decision does not change that thesis.
Gold vs silver right now — which one?
The data points toward silver as the more interesting opportunity at current prices for three specific reasons: the deeper discount (46% vs 21% from peak), the structural supply deficit that exists independent of monetary policy, and the gold-to-silver ratio approaching historical levels where silver has outperformed on recoveries. Gold is the safer, more liquid, lower-volatility option. Silver is the higher-risk, higher-potential-return option. For a small portfolio addition, gold’s stability makes it the more appropriate starting point. For investors who already have gold exposure and are looking for leverage on a metals recovery, silver’s deeper pullback makes it worth considering.
Start investing: 7 Best Investment Apps for Beginners in 2026 — Start With Just $100
Frequently Asked Questions
Is now a good time to buy gold in 2026?
Gold at $4,405 is 21% below its January 2026 all-time high of $5,589 — a meaningful discount from the peak. Whether that represents a good buying opportunity depends on your investment thesis. If you are buying gold as a long-term inflation hedge and currency debasement protection, the structural case — $40 trillion in US debt, record central bank buying, persistent inflation above the Fed’s 2% target — remains intact regardless of short-term rate decisions. If you are buying gold hoping for a quick return to $5,589, you are making a short-term price call that even professional analysts disagree on by $1,940 per ounce in their year-end forecasts.
Why did gold fall after the Fed raised rates?
Rate hikes raise real yields — the return on cash and bonds after inflation. Gold pays no yield. When real yields rise, investors sacrifice more potential income by holding gold instead of bonds, making gold relatively less attractive. This is the standard mechanism, and it played out exactly as expected on September 16. What surprised many observers was how quickly gold recovered — gaining back most of its losses within 18 hours of the announcement. This post-FOMC round trip suggests the rate hike was already largely priced into gold before it happened, and once the uncertainty resolved, buyers returned.
Is silver a better investment than gold right now?
At current prices, silver offers a deeper discount from its 2026 peak (46% vs 21% for gold) and a structural supply story — six consecutive annual deficits totaling 762 million ounces of above-ground stock drawdown — that exists entirely independently of monetary policy. The gold-to-silver ratio at approximately 67 is approaching the historical range where silver has typically outperformed gold on recoveries. However, silver is also significantly more volatile than gold — its price can swing 2 to 3 times more than gold on any given day. For a beginner’s first precious metals position, gold’s lower volatility makes it the more appropriate starting point. Silver makes sense as a complement to an existing gold position for investors comfortable with higher volatility.
Final Thoughts
Gold crashed and recovered within 18 hours of the Fed’s first rate hike since 2023. That round trip — from $4,423 to $4,294 and back toward $4,405 in a single day — is the most revealing data point of the week.
It tells you that the rate hike was priced in. That the buyers who had been waiting for this pullback were ready. That the structural demand — $40 trillion in US debt, central banks buying 289 tonnes in a single quarter, silver’s sixth consecutive supply deficit — did not change because of one Fed meeting.
JPMorgan sees $6,300 gold by year end. Bank of America sees $4,360. Goldman Sachs splits the difference at $5,400. The gap between them reflects genuine uncertainty about whether the Fed hikes again or pauses — a question that September’s data alone cannot answer.
What is clearer: both metals are trading at significant discounts to their 2026 peaks. The structural case has not weakened. Central banks are treating every dip as a buying opportunity. And the 18-hour post-FOMC recovery suggests the market has more buyers than sellers at current levels.
Whether that makes today a buying opportunity depends on whether precious metals have a job in your portfolio. If they do — the current discount is the best entry point since the spring.