
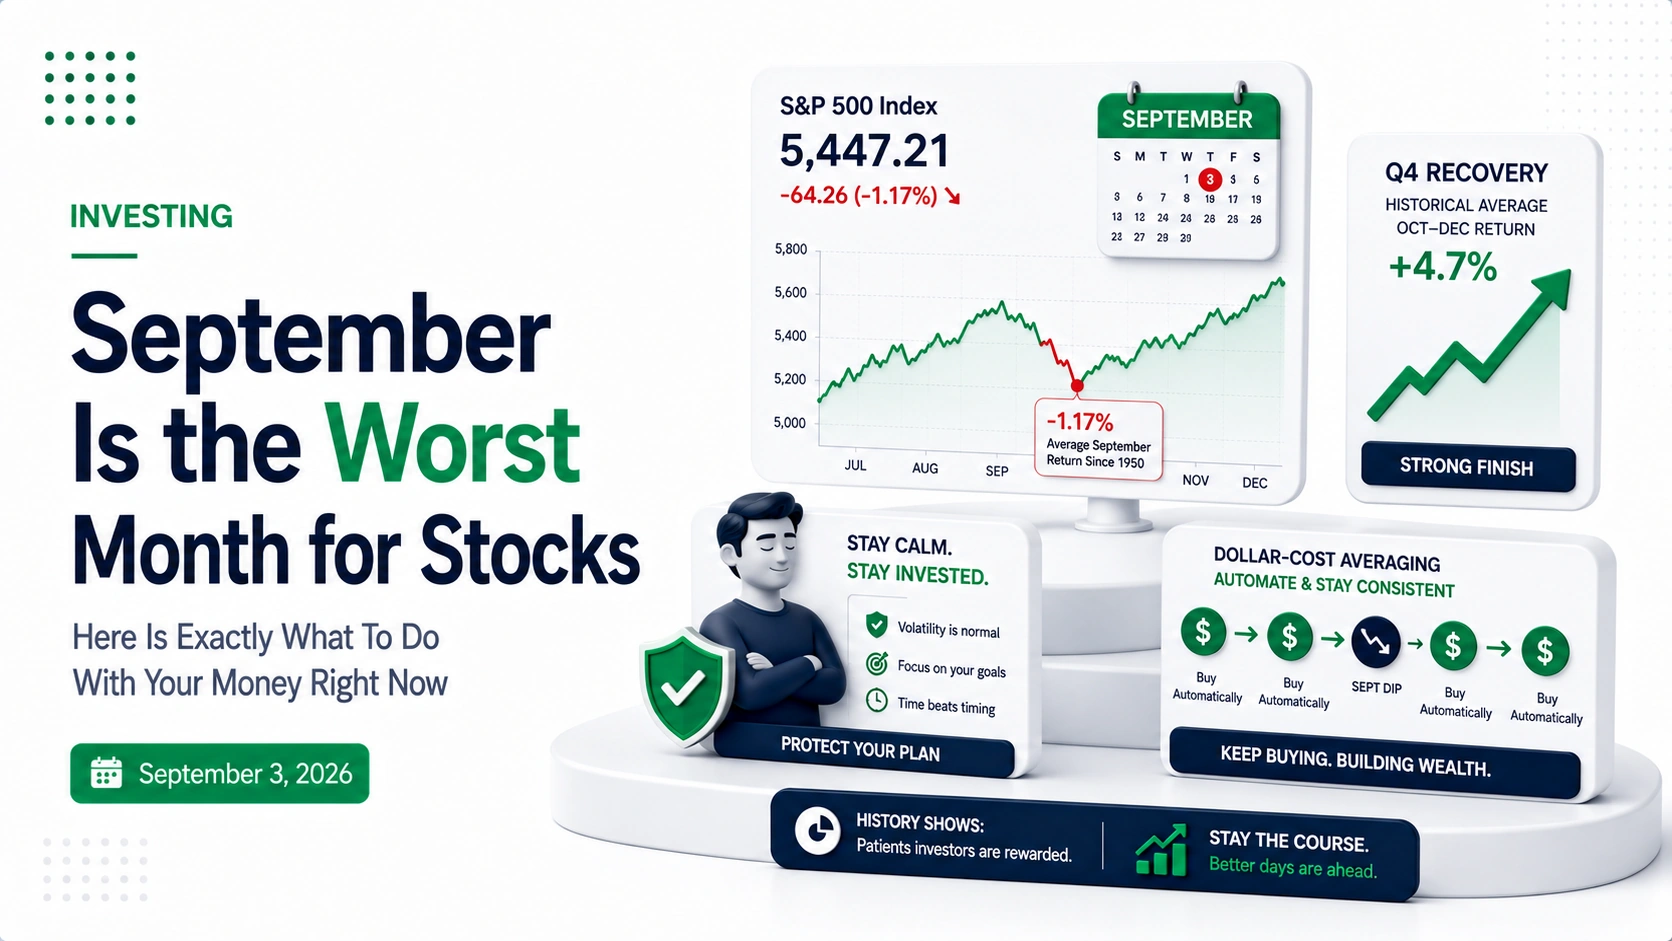
- Since 1928, the S&P 500 has averaged a return of -1.17% in September — the only month with a consistently negative long-term track record
- September 2026 adds extra pressure: rate hike odds rising, US-Canada trade disputes brewing, and the Iran conflict reaching its six-month mark
- The single most expensive mistake investors make in September is panic-selling — missing just the 10 best days in a market reduces a 30-year return by 56%
- September is positive 44% of the time — the “September Effect” is a tendency, not a guarantee, and current market trend matters more than the calendar
- The FOMC meeting on September 15–16 and quad witching on September 18 are the specific dates that will determine how volatile this month gets
Today is September 3, 2026. The stock market just entered its worst month of the year.
Since 1928, the S&P 500 has averaged a return of -1.17% in September. It has fallen in 56% of all Septembers since then. It is the only month in the calendar with a negative long-term average return. Wall Street calls it the September Effect — and it is the most documented seasonal pattern in market history.
This September has extra pressure behind it. Rate hike odds have nearly doubled following Fed Chair Kevin Warsh’s remarks at Jackson Hole. New trade disputes are brewing between the US and Canada. The Iran conflict is hitting its six-month mark. And the S&P 500 is coming in near record highs — historically, September weakness is amplified when the market enters the month at elevated levels.
So what should you actually do with your money right now?
The honest answer is probably not what the financial headlines are suggesting — and definitely not what fear is whispering.
What the September Effect Data Actually Shows
The September Effect is the most well-documented seasonal pattern in market history — and also one of the most misunderstood.
Here is what the data actually says, stripped of the sensationalism:
| Time Period | Average September Return | % of Years Negative |
|---|---|---|
| 1928–2023 (full history) | -1.17% | 56% |
| 2017–2025 (recent decade) | -1.4% | ~60% |
| All other months (average) | +1.5% to +2% | ~35–40% |
September is the only month with a negative long-term average return. Every other month averages a positive return. That makes September genuinely unusual — not just slightly below average, but the only outlier in 12 months of data spanning nearly a century.
But here is what the headline data hides: September is positive 44% of the time. A tendency is not a guarantee. The September Effect is an average — and averages are made up of enormous variation. In 2019, September returned +1.72%. In 2010, +8.76%. In 2021, +4.65%. The month is historically weak, but predicting any specific September based on historical averages alone is little better than a coin flip.
The more important variable — confirmed by multiple analysts this week — is where the market is relative to its trend when it enters September. The S&P 500 set a record close on August 12 on a cooler CPI print and is finishing August back near those highs — which puts 2026 in the historically favorable bucket. Markets entering September above their long-term trend have historically performed better in September than markets entering the month already weak.
External resource: History says September is the worst month for stocks — what investors should do — Motley Fool
Why September 2026 Is Different — And What to Watch
This September has specific catalysts that make it more volatile than a typical September — and two specific dates that will determine most of the month’s direction.
The macro backdrop is genuinely challenging
Rate hike odds have nearly doubled following Fed Chair Kevin Warsh’s Jackson Hole speech. New trade disputes are developing between the US and Canada. The Iran conflict is hitting its six-month mark with no resolution in sight. Oil opened at $90.21 per barrel today. On top of history, there is plenty of current uncertainty swirling around as we enter September 2026, with the odds for interest rate hikes increasing, new trade disputes brewing between the US and Canada, and the war between the US and Iran reaching the six-month mark.
The two dates that matter most
Two specific events will drive most of September 2026’s volatility:
- September 15–16 — FOMC meeting with projections. The Federal Reserve’s decision on whether to hike, hold, or signal cuts will be the single biggest market-moving event of the month. If Warsh signals another rate hike, markets will likely sell off sharply. If he holds and signals a pause, markets may rally despite seasonal headwinds.
- September 18 — Quad witching. Quarterly expiration of stock index futures, stock index options, stock options, and single-stock futures all occur simultaneously. Quad witching days historically see dramatically elevated volume and volatility as institutional investors reposition large derivatives positions. This is a day for experienced traders — beginners should avoid making new investment decisions on or immediately around quad witching dates.
These two events make September 18 to 19 the highest-risk window of the month. The market’s reaction to the FOMC outcome on the 15th and 16th will set the tone for how the quad witching on the 18th plays out.
The Most Expensive Mistake Investors Make in September
The September Effect creates fear. Fear creates the impulse to sell. And selling in response to seasonal patterns is one of the most reliably wealth-destroying decisions an investor can make.
Here is the data that makes this concrete:
If anyone invested $10,000 in the S&P 500 in 1996 and held it through 2025, that initial $10,000 would be worth $192,167. But just missing the 10 best days lowered that return potential by 56% to $85,490.
Ten days. Out of approximately 7,500 trading days over 30 years. Missing just those ten best days — which are impossible to predict in advance — cuts your final wealth nearly in half.
And here is the compounding cruelty of market timing: from 1996 to 2025, 48% of the best days for the S&P 500 were during a bear market, according to the Hartford Funds. The best days happen when fear is highest — exactly when the impulse to sell is strongest. The investor who sells during a September downturn is almost always the one who misses the recovery rally that follows.
The contrarian insight that changes how you see September: if the market does fall in September 2026, the Motley Fool’s analysis published yesterday puts it plainly — investors should treat any substantial declines this month as opportunities to buy an S&P 500 index fund or quality stocks. A bad September is not a warning to exit. It is historically a setup for a strong Q4.
Understand how to invest properly first: How to Invest in Index Funds — Complete Beginner Guide
5 Smart Moves to Make Right Now
Not selling is a decision. Here are five things you should actively do in September 2026 — all grounded in what the data actually supports.
Move 1 — Keep your automatic contributions running
If you have automatic monthly or biweekly investment contributions set up, do not pause them. September weakness — if it materializes — means your scheduled contributions buy at lower prices than they would have in August. Dollar-cost averaging is not just a strategy for avoiding bad timing on the way up. It is a mechanism that automatically buys more when prices are lower. A down September is the month your automatic contributions do their best work.
Move 2 — Review your portfolio allocation — not to change it, but to see it clearly
September is a good time to check whether your current stock and bond allocation still matches your actual risk tolerance and time horizon — not because of the September Effect, but because portfolio drift happens naturally as some assets outperform others. If your target allocation is 80% stocks and 20% bonds and strong stock performance has pushed you to 90/10, a September pullback might actually rebalance you back toward your target automatically. Know where you stand before the volatility arrives.
Move 3 — Build or review your watchlist
If the market does pull back in September, you want to already know what you would buy and at what price — not make that decision under the emotional pressure of watching prices fall in real time. Make a list now: what index funds or stocks would you add to your portfolio if they dropped 10% this month? Having the list ready transforms a potential market decline from a source of anxiety into a pre-planned shopping opportunity.
Move 4 — Ensure your emergency fund is intact
Market volatility is psychologically hardest to tolerate when your financial safety net is thin. If your emergency fund is below 3 months of expenses, a September market decline creates a real risk that you will be forced to sell investments at depressed prices to cover an unexpected expense. Before any market uncertainty, confirm that your emergency fund is funded first — this is what makes staying invested during volatility emotionally possible rather than just theoretically advisable.
Build it: How to Build an Emergency Fund Fast
Move 5 — Avoid making new investment decisions around September 18
Quad witching on September 18 creates artificial volume and volatility driven by derivatives expiration rather than fundamental changes in the value of companies. Price movements on and around quad witching dates are disproportionately influenced by institutional positioning and derivatives mechanics rather than real economic signals. For a long-term investor, the right move on quad witching day is usually no move at all.
What This Means Specifically for Beginners
If you are new to investing and September’s reputation is making you nervous about starting or continuing — here is the direct answer.
The September Effect should not change anything you are doing as a beginner investor. Here is why:
- If you are not yet invested — September is not a reason to wait. The data does not support waiting for the “right month” to start. Time in the market consistently beats timing the market, and a -1.17% average September loss is recovered in approximately two weeks of an average October.
- If you are already invested — do nothing different. Keep your contributions running. Do not check your portfolio daily. The S&P 500 has recovered from every single September decline in its 98-year tracked history. There is no reason to believe September 2026 will be the exception.
- If September does produce a meaningful pullback — treat it as what the data says it is: a historically common seasonal event that has preceded some of the strongest Q4 rallies on record. The S&P 500’s average Q4 return is approximately +4.2% — the best quarter of the year, following the worst month of the year.
The biggest risk for a beginner investor in September 2026 is not a market decline. It is letting fear of a market decline cause a decision that permanently reduces long-term wealth — selling, pausing contributions, or avoiding investing entirely because the calendar says September.
Start investing with confidence: 7 Best Investment Apps for Beginners in 2026 — Start With Just $100
Frequently Asked Questions
Should I sell my stocks before September gets worse?
No — and the data is clear on this. The S&P 500 falls by more than 1% on average in September. However, selling and waiting until the month passes is not a smart idea. The cost of missing the recovery typically exceeds the loss avoided by selling. Markets can reverse direction in days — the investors who sold at the start of September in years when the market subsequently rallied lost far more in missed gains than they would have lost by staying invested through a modest decline. The single correct response to September’s bad reputation is to stay the course.
Is 2026 going to be a bad September specifically?
Nobody knows — including the analysts publishing September outlooks today. What the data shows is that the S&P 500 is entering September 2026 above its long-term trend after strong August performance, which historically places this year in the better-performing bucket of Septembers rather than the worse-performing one. The FOMC meeting on September 15–16 and quad witching on September 18 are the two specific catalysts that will most influence how the month unfolds. A dovish Fed signal could easily push September 2026 into positive territory despite the historical average.
What has historically happened in October after a bad September?
October has averaged a positive return of approximately +0.5% to +1.5% historically — and the fourth quarter as a whole averages approximately +4.2%, making it the strongest quarter of the year. The pattern is consistent enough that professional investors often describe bad Septembers as “setting up” a strong Q4 rally. This does not mean every bad September is followed by a strong October — but it does mean the seasonal pattern argument for selling in September is weakened by the equally strong seasonal argument for staying invested into Q4.
Final Thoughts
September is the worst month for stocks. That is a fact backed by nearly 100 years of data. It is also a fact that September is positive 44% of the time, that the S&P 500 has recovered from every September decline in its history, and that the investors who panic-sell in September consistently underperform the ones who stay the course.
September 2026 has genuine macro headwinds — rising rate hike odds, geopolitical tensions, and two high-volatility dates on the calendar. It may well produce a negative return. If it does, the historically correct response is to keep your contributions running, add to your watchlist positions, and remember that October has historically been where September’s losses are recovered.
The calendar is not an investing strategy. Staying invested is.